



OKR Experts® Practical Guide · As of November 2026
OKR vs. KPI: The Difference and How They Work Together
By Erno Marius Obogeanu-Hempel · Last updated: November 1, 2026
OKR vs. KPI isn’t an either/or situation: KPIs show whether your business is performing well, while OKRs ensure that the right changes are made. We explain the difference, use a comparison table and real-world examples to show when to use each tool, and explain how to combine them into a single management system.
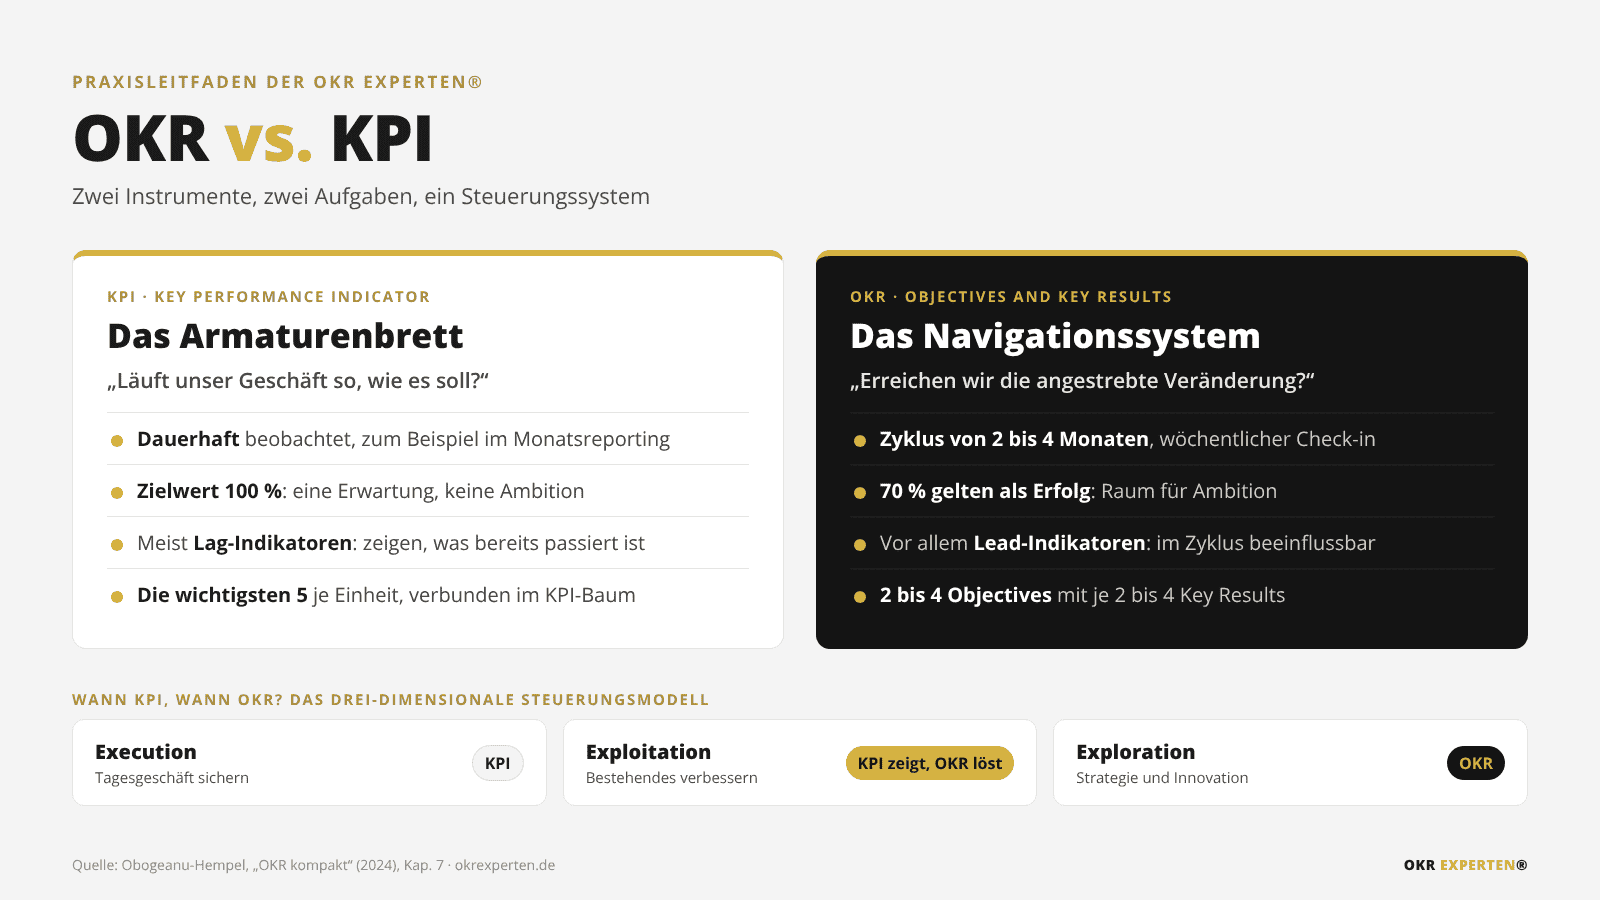
OKR vs. KPI: The Key Points at a Glance
- KPIs (Key Performance Indicators) show whether the current business is healthy. They are monitored on an ongoing basis and are expected to reach 100% of their target values.
- OKRs (Objectives and Key Results) are a goal-setting system designed to drive change: A qualitative objective describes the desired state, while two to four measurable key results indicate whether the desired impact is being achieved. An OKR cycle lasts two to four months.
- To put it figuratively: KPIs are the dashboard, and OKRs are the navigation system. You need both.
- Rule of thumb: Use KPIs to manage day-to-day operations. Use OKRs to implement strategy, innovation, and targeted improvements.
- KPIs and OKRs are intertwined: A KPI identifies a need for action, a set of OKRs addresses it, and KPIs serve as metrics, guardrails, or annual goals.
- With KPIs, 100% is considered the target; with OKRs, 70% is considered a success. Neither should be tied to bonuses if you want honest, ambitious goals.
300+ companies and organizations supported4-time award winner: WirtschaftsWoche “Best of Consulting” in 2023 and 2025Author of the book “OKR Compact”
Schedule a Free Initial Consultation We’ll show you how to integrate your KPIs and OKRs into a management system.
Contents
- Video: OKR vs. KPI in Three Minutes
- 1. The Difference Between OKRs and KPIs in One Sentence
- 2. What are KPIs?
- 3. What are OKRs?
- 4. OKR vs. KPI: A Comparison
- 5. When to Use KPIs, When to Use OKRs? The Three-Dimensional Management Model
- 6. How OKRs and KPIs Work Together
- 7. Lead, Lag, Vanity: Which Metric Is Best Suited as a Key Result?
- 8. Practical Example: From KPI to OKR Set in Five Steps
- 9. Common Mistakes with OKRs and KPIs
- 10. Distinctions: OKR, KPI, MbO, and the Balanced Scorecard
- 11. Conclusion: OKR vs. KPI
- Frequently Asked Questions
- Sources
OKR vs. KPI Explained in a Video
In just over three minutes: the key differences, three examples of how they work together, a real-world example of how to transition from KPIs to an OKR set, and three common mistakes from consulting practice.
Why the Question “OKR or KPI?” Is Misframed
“We already have KPIs. Why do we need OKRs too?” We hear this question in almost every initial meeting. It’s a valid question, because at first glance, they seem the same: Both use metrics, both have target values, and both end up in dashboards.
The difference lies not in the number, but in the purpose. KPIs answer the question, “Is our business running as it should?” OKRs answer the question, “Are we achieving the change we set out to make?”
Companies that rely solely on KPIs often manage the status quo very well but are slow to implement their strategy. Companies that adopt OKRs without KPIs quickly lose sight of day-to-day operations and end up incorporating routine operational tasks into their OKR sets.
In this comparison of OKRs and KPIs, we show how these two tools can be clearly distinguished from one another while still being interconnected. This analysis is based on our book *OKR Compact* and our experience working with over 300 companies and organizations—ranging from small craft businesses to energy conglomerates and public administration agencies—where we have helped implement OKRs.
1. The Difference Between OKRs and KPIs in One Sentence
KPIs continuously measure whether the existing business is performing well. OKRs set goals for change over a short cycle of two to four months and measure whether that change achieves the desired impact.
The illustration from our book makes it easy to understand: Imagine you’re driving a car. The gauges on the dashboard—such as the fuel gauge, temperature gauge, tire pressure gauge, and battery indicator—tell you whether everything is okay with the vehicle. Those are your KPIs. The navigation system shows you whether you’re on the right path to your destination. That’s OKR. And the travel guide determines where the journey is headed in the first place: your strategy.
A dashboard without a navigation system will get you there safely, but aimlessly. A navigation system without a dashboard will guide you purposefully—until the engine overheats.
2. What are KPIs?
A KPI (Key Performance Indicator) is a metric that reflects the status and performance of a company, a division, a team, or a process. Not every metric is a KPI. A KPI is one of the few metrics that can indicate whether the business is “healthy.” That is why it is also referred to in English as “business health ” or “health metrics.”
Typical KPIs
- Finance: Revenue, Contribution Margin, Liquidity, Accounts Receivable Turnover
- Sales: New Orders, Quote-to-Order Ratio, Close Rate
- Customer Service: Customer Satisfaction, Wait Time, First-Time Resolution Rate
- Production and Quality: Scrap Rate, Lead Time, On-Time Delivery
- Human Resources: Turnover, Sick Leave Rate, Time to Fill a Position
What Sets KPIs Apart
- Ongoing: KPIs are monitored continuously, not just for a single cycle.
- Target value of 100%: A KPI target is to be met. A rejection rate of no more than 2% is not an ambitious goal, but rather an expectation.
- Mostly retrospective: Many KPIs are lag indicators. They show what has already happened (more on this in Section 7).
- A few per unit: The five most important KPIs for each business unit, department, and team have proven effective; ideally, these are organized into a KPI tree that shows how the metrics at one level contribute to the next higher level. Additional KPIs are reviewed from time to time.
- For every area: KPIs exist at every level, right down to individual processes.
KPIs play a central role in ISO 9001 quality management systems: The standard requires measurable quality objectives and their regular monitoring (ISO 9001:2015, Section 6.2). If the values deviate, corrective actions must follow. This is precisely where OKRs can come into play, as we’ll show in Section 6.
3. What are OKRs?
OKR (Objectives and Key Results) is a method for implementing strategy and setting goals. An OKR set consists of two parts:
- Objective: a qualitative, inspiring goal that describes the desired state and its benefits.
- Key Results: two to four measurable key results that indicate whether the objective is being achieved. Good key results measure the outcome—that is, the result, benefit, and impact—rather than the output, such as a finished product, concept, or completed task.
We recommend two to four Objectives per unit, each with two to four Key Results. This is intentionally fewer than is common in many places, because OKRs are meant to promote focus. An OKR cycle lasts two to four months, usually a quarter. Due to the acceleration driven by AI, more and more companies are opting for shorter cycles (see our article “When AI Learns Faster Than Your OKR Cycle”).
The process follows a set rhythm: OKR planning at the beginning, a weekly OKR check-in with a score and confidence level, and an OKR review and retrospective at the end of the cycle.
An achievement rate of 70% is considered a success for outcome goals, with the exception of safety and compliance. This creates room for ambitious goals and a genuine culture of learning. Google also describes a range of 60 to 70% as the “sweet spot” for evaluating OKRs in its re:Work guide (Source: Google re:Work).
Here’s an example from our seminars: A startup is bringing a medical diagnostic device to production.
Objective: Wehave launched a mass-market medical diagnostic device for end users to help as many people as possible achieve better health and well-being.
Key Result 1: Wehave improved the user-friendliness rating from 2.1 to 4.5 stars (out of 5) so that the device can be used regardless of age, ability, or education.
Key Result 2: Weincreased diagnostic accuracy from 20% to 90% to detect diseases early.
Key Result 3: Wesold 10,000 diagnostic devices to scale the study and fund further development.
You can find more information on the basics on our page about implementing OKRs and in a concise format in the OKR Cheat Sheet.
4. OKR vs. KPI: A Comparison
The following table provides a direct comparison of OKRs and KPIs. It is based on the comparison in Chapter 7.5 of our book “OKR Compact,” supplemented by insights from our consulting practice.
| Characteristic | OKR | KPI |
|---|---|---|
| Key Question | Are we achieving the desired change? | Is our business running as it should? |
| Purpose | Implement strategy (Exploration) and improve operational excellence (Exploitation) | Monitor business health and day-to-day operations (Execution), identify areas for improvement |
| Analogy | Navigation system: the destination comes from the travel guide (strategy) | Instruments on the dashboard |
| Structure | A qualitative objective plus two to four measurable key results | A single metric with a target value or tolerance range |
| Time Frame | A cycle of two to four months, usually a quarter | Ongoing, with annual, quarterly, or monthly goals |
| Metrics | Outcome Goals: Results, Benefits, Impact | Mostly input, output, and impact metrics; in some cases, outcome metrics as well |
| Indicators | Primarily lead indicators, supplemented by lag and vanity indicators | Mostly lagging indicators, as well as leading and vanity indicators |
| Number | Two to four objectives, each with two to four key results per unit | The five most important KPIs per unit, linked in the KPI tree |
| Review | Weekly during the OKR check-in (score, confidence level); review at the end of the cycle | Continuously, for example in monthly reporting |
| Goal Achievement | 70% is considered a success (except for security and compliance) | 100% is the expectation |
| Alignment | Top-down from the strategy and bottom-up from the teams, coordinated horizontally | Mostly dictated top-down or derived from processes |
| Compensation | Do not link to bonuses or performance evaluations | Often part of performance agreements, with well-known side effects |
Important: The table outlines key areas of focus, not rigid boundaries. Revenue can be a KPI and, at the same time, appear as a metric in a key result. What matters is how you use the number.
5. When to Use KPIs, When to Use OKRs? The Three-Dimensional Management Model
Most articles comparing OKRs and KPIs conclude with “You need both.” That’s true, but it doesn’t help answer the question of which topic belongs where. To address this, we use the Three-Dimensional Management Model. It expands the well-known concept of ambidexterity (exploring the new and improving the existing) to include a third dimension: day-to-day operations. Every organization must manage all three areas simultaneously:
| Section | What It’s All About | Control |
|---|---|---|
| Exploration Strategy Implementation |
Explore and test new business models, products, and markets, including those that challenge our own business | OKR |
| Exploitation : Optimizing Day-to-Day Operations |
Improving existing business models and processes, for example through cost reduction, automation, AI, or new digital channels | KPIs identify the need; OKRs drive the improvements |
| Execution : Quality Assurance in Day-to-Day Operations |
Business as usual: reliably executing and monitoring ongoing processes | KPIs |
This leads to a clear rule: Operational routines do not belong in OKR sets. If a team formulates “We issued all invoices on time” as a Key Result, that’s a KPI in OKR disguise. OKRs should only include topics where change is intended.
Decision-Making Guide: Five Questions to Consider
- Should things change, or should they stay the same? Change speaks in favor of OKRs; stability speaks in favor of KPIs.
- Is this issue important and urgent for this cycle? Only then does it belong in an OKR set. We like to use the Eisenhower Matrix for prioritization.
- Do we know the way to our goal? If so, and if it’s just a matter of execution, KPIs and a project plan are sufficient. If the path is open and the team has to figure it out for themselves, OKRs are the right fit.
- Will this topic continue indefinitely? Then, after the OKR cycle, it becomes a KPI again.
- Is the target value an expectation or an ambition? If it’s an expectation (100%), it’s a KPI; if it’s an ambition (70% is considered a success), it’s a key result.
6. How OKRs and KPIs Work Together
In practice, OKRs and KPIs are linked in five ways. Understanding these patterns helps you avoid duplicate structures.
6.1 The KPI identifies the need; the OKR set addresses it
This is the most common and valuable scenario. A KPI falls outside the target range—for example, customer satisfaction with the hotline. During OKR planning, each team reviews not only the topics from the strategy but also its performance data: Which KPIs or processes are not performing optimally? If the issue is both important and urgent, it results in an OKR set in the “Exploitation” category. Once the KPI has stabilized again, it continues to be monitored as part of day-to-day operations.
6.2 The KPI becomes a metric in the Key Result
A key result can use a KPI as a metric, but it doesn’t have to. The difference from a pure KPI lies in the goal: A key result describes a significant improvement over a limited period of time, for example, “We increased hotline customer satisfaction from 2.5 to 4.5 stars.”
According to OKR experts, every Key Result includes an objectively measurable impact metric, a definition of how it is measured, a data source, and a baseline value from a specified time period. Without a baseline value, progress cannot be measured.
6.3 The KPI Becomes a Guardrail
Key Results intentionally leave the path to the goal open. This includes undesirable paths. If you’re concerned about things going off track, add a KPI as a guardrail in the form of a separate Key Result.
A classic example: A sales team is tasked with increasing revenue. The margin guardrail ensures that products are not sold below cost. A guardrail is optional and only makes sense where there is a genuine risk. Our article on Goodhart’s Law explains why key metrics lose their meaning without guardrails.
6.4 KPIs as Annual Goals, OKRs for the Cycle
We advise against using annual OKRs. The method is applied differently than in short cycles, which almost always leads to confusion in practice (see Annual OKRs vs. Quarterly OKRs).
We’ve had good results with annual goals in the form of KPIs with a 100% target achievement rate, supplemented by a target vision based on Amazon’s “Working Backwards” method: a fictional year-end press release that describes what has been achieved and includes KPI targets. From this, you derive an annual roadmap and OKR sets for the individual cycles.
6.5 A Shared Routine Instead of Two Separate Worlds
OKRs and KPIs don’t require separate meetings. During the weekly OKR check-in, the OKR sets are discussed first, followed by the most important operational KPIs. In the OKR review at the end of the cycle, after discussing the status of the OKR sets, the focus shifts to KPI target achievement, including the question of whether a KPI deviation should lead to a new OKR set. In this way, both systems are linked in a coordinated rhythm. The check-in is an agenda item in the existing regular meeting, not an additional meeting.
7. Lead, Lag, Vanity: Which Metric Is Best Suited as a Key Result?
In OKR, it is permissible to use KPIs as Key Results. However, whether a metric is suitable as a Key Result depends heavily on what type of indicator it is. We distinguish between three types: lead, lag, and vanity indicators.
| Characteristic | Lead Indicator | Lag Indicator | Vanity Indicator |
|---|---|---|---|
| German | Early or Leading Indicator | Lagging indicator | Vanity indicator |
| Direction of View | Looking Ahead | Looking back | Looking very far ahead |
| Can the cycle be influenced? | Yes | Usually not anymore | Yes, but not very meaningful |
| Relation to Success | High | High; measures the actual result | Low to unclear |
| As a Key Result | Ideal, first choice | Just as a supplement | Only as a supplement |
| As a KPI | Useful | Useful, especially for annual goals and reviews | Depending on the purpose |
This classification is relative. For an online store, revenue is a leading indicator because it is generated immediately upon an order being placed. For a kitchen showroom or a machinery manufacturer, the same revenue follows the sales process and is a lagging indicator. In those cases, the number and volume of orders are the leading indicators, whereas the number of visitors at an open house is a vanity indicator.
The number of social media followers is meaningless to a sales team, but it is a relevant leading indicator for the social media team.
This explains a fundamental pattern in the comparison: KPIs are often lag indicators because they document results. Key Results should primarily use lead indicators, because the team can still influence them during the current cycle. Be cautious with lag indicators that have a long delay: An increase in employee turnover reflects causes that may have long since been resolved, while new factors are already taking effect.
A helpful tool for finding the right metrics is to look at a funnel (such as marketing and sales or recruiting), a process, or the customer journey.
8. Practical Example: From KPI to OKR Set in Five Steps
The following example is based on a case from our book. The numbers are chosen for illustrative purposes.

Step 1: Identify the deviation
The “Hotline Customer Satisfaction” KPI has been at 2.5 out of 5 stars for the past two quarters. The average wait time is 4.6 minutes, and ratings in the App Store are declining.
Step 2: Prioritize
During OKR planning, customer service asks: Is this issue important and urgent? Does it contribute to a top-level OKR set? Both are true; company leadership has identified customer satisfaction as a priority. The issue becomes an OKR set in the Exploitation category.
Step 3: Formulate the objective
The objective describes the desired state and its benefits, not the action:
Objective: We have significantly improved customer satisfaction with our hotline to ensure that our customers receive professional service every time they contact us.
Step 4: Define Key Results with Measurement Criteria and Guardrails
Key Result 1: Weincreased hotline customer satisfaction from 2.5 to 4.5 stars (out of 5).
Key Result 2: Wereduced the average wait time on the hotline from 4.6 to less than 1 minute.
Key Result 3 (Guardrail)We have maintained the first-call resolution rate at least at the baseline level to ensure that shorter wait times do not come at the expense of resolved issues.
Notice what isn’t mentioned here: “We’ve trained all agents” or “We’ve implemented a chatbot.” These are tasks or outputs. They belong at the task level under Key Results, where the team itself decides which actions will produce the desired impact.
Step 5: Back to the World of KPIs
At the end of the cycle, the OKR review shows what has been effective. If satisfaction remains stable within the target range, the OKR set ends. The metric is then monitored again as a KPI in day-to-day operations, with a higher target value if necessary. In this way, an improvement becomes the new standard.
9. Common Mistakes with OKRs and KPIs
- Business as usual in the OKR set: Routine tasks and standard KPIs are entered as Key Results. The result: cluttered OKR sets that lack focus. Routine tasks belong in KPI management.
- “KPI plus 10%” as an OKR: An existing KPI target is simply increased and labeled an OKR. Without considering the impact or proposing a new solution, this is nothing more than a stricter budget.
- Output vs. Outcome: “Concept developed,” “Software implemented,” and “Workshop conducted” are tasks, not key results. Always ask: What should this change for customers, employees, or the company?
- Vanity metrics as the sole measure: Clicks, downloads, or followers may look impressive, but they often say little about success. They’re acceptable as a supplement, but not as the sole key result.
- Key Results Without a Baseline: If you don’t know where you’re starting from, you can’t measure your progress. The definition of the metric, the data source, and the baseline must be established before the cycle begins.
- Linking OKRs to Bonuses: If compensation is tied to OKR goal achievement, teams set their goals lower to ensure they receive the reward. This undermines the purpose of OKRs. In “Drive,” Daniel Pink shows that autonomy, purpose, and mastery are stronger motivators than rewards when it comes to complex tasks.
- Too many metrics: One hundred KPIs and ten OKR sets per team generate reports but don’t provide guidance. Five KPIs and two to four objectives per unit are almost always enough.
Many of these mistakes occur when organizations “try out” OKRs without guidance. If you’d like to assess where your organization stands, our OKR Health Check is a good place to start.
10. Distinctions: OKR, KPI, MbO, and the Balanced Scorecard
In addition to OKRs and KPIs, you’ll often encounter two other approaches in companies:
- Management by Objectives (MbO): In 1954, Peter Drucker described management through agreed-upon objectives in *The Practice of Management*. In practice, MbO often took the form of annual, individual goal-setting tied to compensation. Andy Grove further developed this concept into OKR at Intel, with shorter cycles and measurable Key Results, and described the approach in 1983 in *High Output Management*. John Doerr brought OKR to Google in 1999 and popularized the method with*Measure What Matters*(2018).
- Balanced Scorecard (BSC): In 1992, Robert Kaplan and David Norton presented a performance measurement system in the Harvard Business Review that supplements financial metrics with perspectives on customers, processes, and learning and development. The BSC thus serves as a structured framework for KPIs and strategic goals and integrates well with OKRs. Learn more on our Balanced Scorecard page.
In short: KPIs and the Balanced Scorecard describe what you measure and monitor. OKRs describe what should change in the next cycle and provide the focus, alignment, and a fixed management cycle to achieve that.
11. Conclusion: OKR vs. KPI
The bottom line is that OKR vs. KPI isn’t a choice between two methods: OKRs and KPIs aren’t competitors, but rather two tools with different purposes. KPIs support day-to-day operations and highlight where problems lie. OKRs implement strategy and improvements in short cycles and measure whether they’re effective.
The key lies in the distinction: Routine remains part of KPI management, while change comes through OKR sets. And in the connection: KPIs provide triggers, metrics, guardrails, and annual goals, while OKRs track progress.
Those who establish this logic clearly from the start avoid the most common mistakes made when implementing OKRs and achieve what it’s really all about: greater focus, greater impact, and a strategy that translates into everyday practice.
What OKR Experts’ Customers Say
“The OKR experts not only provided us with competent and focused guidance during the rollout of the OKR methodology, but also took the effectiveness of OKR in our organization to a whole new level. […] This enables us to use the tailored OKR methodology more efficiently and effectively than ever before—including to tap into new business areas.”
Hans-Martin Hellebrand, Member of the Executive Board, badenova
“We’re very happy with the OKR experts, who—as a scale-up in our challenging growth phase—have helped us tremendously to take OKR and other tools to the next level as we scale! A great personal fit, excellent workshop methods, and a wealth of practical experience with a pragmatic—rather than dogmatic—approach to implementation.”
Thore Backen, Chief of Staff, SoSafe
Would you like to integrate OKRs and KPIs into your company?
In a free initial consultation, we’ll show you how to integrate your existing KPIs and OKRs into a single management system without creating duplicate structures. As a consulting firm that has helped over 300 companies implement OKRs, we’re familiar with the typical pitfalls encountered in real-world practice.
Schedule a Free Initial Consultation View the OKR Cheat Sheet
Would you like to lead the OKR process in your company yourself? In the two-day OKR Coach/Master/Champion seminar, you’ll learn how to set up OKR sets with effective Key Results—certification included. Learn more about OKR consulting from the OKR Experts®.
Frequently Asked Questions About OKRs and KPIs
What is the difference between OKRs and KPIs?
KPIs (Key Performance Indicators) are metrics that consistently show whether the business is performing well. OKRs (Objectives and Key Results) are a goal-setting system designed to drive change: A qualitative objective and two to four measurable key results describe what is to be improved over a two- to four-month cycle and how the impact can be measured. KPIs are the dashboard; OKRs are the navigation system.
Which is better, OKR or KPI?
Neither is better than the other; they serve different purposes. KPIs are useful for monitoring day-to-day operations and identifying deviations early on. OKRs are useful for implementing strategy, fostering innovation, and driving targeted improvements. Companies generally need both.
Can you use OKRs and KPIs at the same time?
Yes, and that’s the norm. KPIs highlight areas where action is needed, which are then addressed in OKR sets. They also serve as metrics in Key Results, as guardrails against undesirable developments, and as annual goals. During the weekly OKR check-in, the most important operational KPIs are discussed based on the OKR sets, creating a shared rhythm for management.
Can OKRs Replace KPIs?
No. OKRs are intentionally designed to focus on just a few areas of change per cycle. They cannot be used to monitor day-to-day operations and all their associated processes. Anyone who tries to map day-to-day operations onto OKR sets overloads them and loses focus. Routine tasks belong in KPI management.
Can a KPI be a key result?
A KPI can serve as a metric within a key result. The Key Result then describes a significant change over a limited period of time—for example, an increase in customer satisfaction from 2.5 to 4.5 stars. A KPI that is only intended to be maintained at its usual level, on the other hand, does not belong as a Key Result in an OKR set, unless it is used as a guardrail.
How many KPIs and OKRs make sense?
The five most important KPIs for each business unit, department, and team—organized into a KPI tree—have proven effective. For OKRs, OKR experts recommend two to four objectives, each with two to four key results per unit and cycle.
How often are OKRs and KPIs reviewed?
OKRs are discussed weekly during the OKR check-in, including their current value, score, and confidence level, and are evaluated at the end of the cycle during the OKR review. KPIs are monitored continuously—for example, in monthly reports—and are also briefly discussed during the check-in and review.
What level of goal achievement is considered a success for OKRs and KPIs?
With KPIs, a 100% target achievement rate is expected. With OKRs, 70% is considered a success for outcome goals because key results are intentionally set at ambitious levels. Exceptions are goals related to security and compliance, which must be fully achieved.
Should OKRs or KPIs be linked to the bonus?
OKRs should not be tied to compensation or performance evaluations. Otherwise, teams will set their goals lower to ensure they receive the reward, and collaboration will suffer. Caution is also advised when it comes to KPIs in goal-setting agreements, because bonus targets create incentives to “window-dress” metrics rather than improve actual results.
Are KPIs always lagging indicators?
No. Many KPIs are lag indicators because they measure results that have already occurred, such as revenue or employee turnover. However, KPIs can also be lead or vanity indicators. The classification depends on the business model: Revenue is a lead indicator for an online store, but a lag indicator for a machinery manufacturer.
About the Author
Erno Marius Obogeanu-Hempel is the founder and CEO of DigitalWinners GmbH and OKR Experten®. He was introduced to OKR in 2012 through his close ties to Silicon Valley and has been helping companies implement OKR and KPIs since 2015.
He is the author of several specialized books, including “OKR Compact,” and co-author of “More Focus, Motivation, and Success with OKR” (Wiley-VCH). He is a keynote speaker and a lecturer at Fresenius University of Applied Sciences. Previously, he served as CTO and CPO at ProSiebenSat.1. More About the OKR Experts
Sources
- Obogeanu-Hempel, E. M. (2024): OKR in a Nutshell. Objectives and Key Results: Simply Explained and Immediately Applicable for Sustainable Success. 2nd ed., Großkarolinenfeld: DigitalWinners GmbH, particularly Chapters 1.4, 6.5, 7, and 8.1. ISBN 978-3-9822092-0-3.
- Doerr, J. (2018): *Measure What Matters: How Google, Bono, and the Gates Foundation Rock the World with OKRs*. New York: Portfolio/Penguin. About the Book
- Drucker, P. F. (1954): *The Practice of Management*. New York: Harper & Brothers.
- Grove, A. S. (1983): *High Output Management*. New York: Random House.
- Kaplan, R. S. & Norton, D. P. (1992): “The Balanced Scorecard: Measures That Drive Performance. ” Harvard Business Review 70(1), pp. 71–79. Read the article
- Pink, D. H. (2009): *Drive: The Surprising Truth About What Motivates Us*. New York: Riverhead Books.
- DIN EN ISO 9001:2015: Quality Management Systems—Requirements, Section 6.2: Quality Objectives and Planning to Achieve Them. About the Standard
- Google re:Work: Set goals with OKRs. https://rework.withgoogle.com/en/guides/set-goals-with-okrs

