

OKR > OKR method >
Key Result as an element in OKR – definition, formulation and examples
Key results are an important element of the OKR method. Without correctly formulated key results and without monitoring them, you will not achieve the set goal. But which indicators or metrics have key results and what is the best way to create them? What are the go’s and no-go’s for key results? This article is only about key results. Follow the link if you would like to find out more about the complete OKR method, i.e. Objectives and Key Results.
Key Result Definition
A key result is a measurable result that is required to achieve the objective. It contains a key figure, preferably with a starting value – in any case with a target value. Key results measure progress towards the goal – like a signpost that shows how close the company is to achieving it. Key Results show how you can make progress towards your goal. The company should view it like a signpost indicating the distance to the destination.
Indicators of a key result
Key results are:
- Quantitative and measurable
- result-oriented
- ambitious
- scheduled
- can be implemented by the team
Quantitative and measurable means that a key result must contain a metric and a number.
Key Results are results-oriented and not a list of tasks. You can compare them to small goals that bring you closer to the objective, the vision. Key results therefore measure the “outcome” and not the “output”.
Key results should be ambitious in order to motivate and challenge the team at the same time.
Key results must be scheduled. This means that results must be delivered during or at the latest by the end of the OKR cycle.
Key results must be realizable by the team, if possible without outside help.
Creating optimal key results
Normally, 2-5 key results should be defined for each objective. For the sake of simplicity, we have decided to give only one negative and one positive example. Our objective: We are the best-known brand in the field of protein sports drinks.
Negative example of a key result:
Increase website traffic.
Why is the key result not optimal?
- It does not contain any metrics
- It does not contain an outcome
Positive example of a key result:
Our website traffic, coming from social media, grows from 200 to 400 visits per month.
Key results must be “smart”
Key Results follow the S.M.A.R.T. logic, i.e. they are:
- specific,
- measurable,
- achievable– although in the context of OKR the term ambitious makes more sense,
- reasonableis more meaningful in the context of OKR,
- time-bound– refers to the end of the OKR cycle, or a point in time before the end of the OKR cycle
Key Results Metrics – Units
| Einheit | Beispiel |
|---|---|
| Geldwährung | Umsatz und Kosten in Euro Schweizer Franken, US-Dollar |
| Zeitdauer | Bearbeitungszeit, Durchlaufzeit, Fortbildungskontingent - in Wochen, Tagen, Stunden |
| Stückzahl | Anzahl Bugs, Reklamationen, Interviews, Kundenbesuche, Onboarding Mitarbeiter, Anzahl Abonnenten, Anzahl Kunden |
| Prozent | Fehlerquote, Servicelevel |
| Index | Cost per Lead (CPL), Bounce Rate, Kündigungsquote (Churn rate) |
| Datum | falls nicht angegeben, Ende des OKR-Zyklus – Launch eines neuen Produktes, Einstellen eines neuen Mitarbeiters, Eröffnen einer neuen Filiale |
Key results – types and examples
In principle, key results are results-oriented. They measure results, benefits or added value.
Note: The key results are intentionally abbreviated and do not fully meet the criteria for optimal key results.
Examples:
- We have increased the Net Promoter Score (NPS) from X to Y.
- We have increased the repurchase rate from X to Y.
- We have kept customer acquisition costs below Y.
Value-oriented key results follow the typical structure described in the next section.
Increase/reduction of a metric from X to Y
X is the baseline where we start, and Y is the goal we want to achieve. It makes more sense to use the “from X to Y” model than to specify a percentage change.
Here are some comparative examples:
1st percentage change: NPS increased by 20%.
2nd absolute change: NPS increased from 40 to 48.
The percentage change (example 1) can be confusing as it is difficult to tell how ambitious the target is. Will the NPS be increased from 5 to 6 or from 40 to 48? An absolute change is therefore more advantageous (example 2).
If we don’t have a baseline because we are starting something new, we remove “X” from the sentence, for example: We have achieved a repurchase rate of Y.
Another option for value-based key results is to maintain a value, for example: We keep the NPS at 48. But stagnation means regression. We therefore advise against using such key results.
Avoid activity-based key results
These types of key results measure the completion of projects, tasks and activities or the delivery of project milestones. Example for the creation of this article:
1. we did some keyword research for “Key Result” and analyzed the competition.
2. we have completed the first version of the article “Key Result as an element in OKR”.
3. we have released the post “Key Result as element in OKR” by date xyz.
4. we have set up position tracking for the keyword “Key Result”.
Purely binary indicators such as a date (achieved/not achieved) should be avoided. A date also indicates tasks and does not stand for results.
Better than example 1 above: A good keyword and competition analysis for the keyword “Key Result” gives us 100 more visitors per month to our website.
Early or late indicators for key results?
A distinction is made between two different types of indicators. “Leading” and “lagging” indicators, i.e. lead and lag indicators. These two types of measurement, which are used to evaluate performance in a company, not only occur repeatedly in the discussion of OKR and Key Results, but also in KPIs and MbO – Management by Objectives.
A lead indicator is a forward-looking measurement. In the case of a diet, for example, this can be the measurement of calorie intake and calorie consumption as well as a measurement of the body fat percentage.
A lag indicator is a lagging output measurement, for example weight or body mass index (BMI) in the case of a diet. While the lead indicator can influence changes, the lag indicator can only record what has happened.
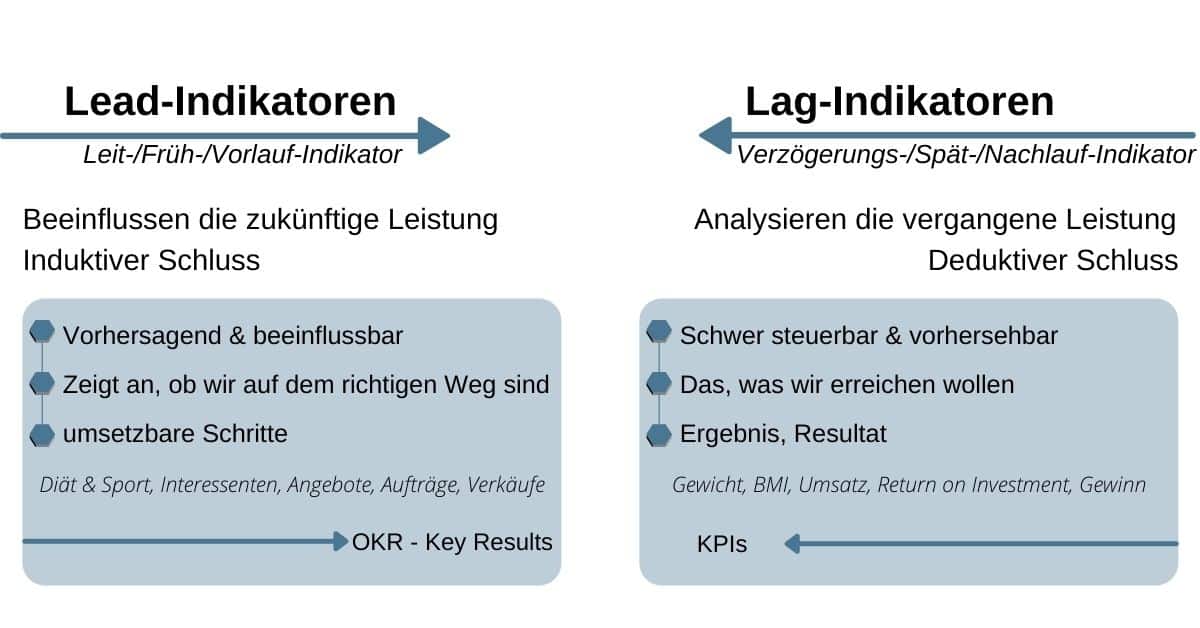
Many companies concentrate on measuring output. This is because they are easy to measure and accurate. To be able to influence the future, a different kind of measurement is required, one that is more predictive or forward-looking – rather than an outcome that has already been completed.
Key results therefore measure the process and KPIs measure the result. This makes it clear that KRs and KPIs are not identical or mutually exclusive. Therefore, these two concepts should be used in a coordinated manner for target management.
Conclusion: For key results, we recommend lead indicators – for measurement, review or the overall view, for example at the end of the year, the recording of lag indicators as KPIs.
Key results are not vanity metrics!
Examples of vanity metrics are the number of registered users, downloads and website views. The most important indicators are retention and repeated use of products or services. Companies that focus on real metrics can improve their products, win more customers and make them happier. It is very important for companies to properly organize the data they track so that they can capture the true “health” of the company.
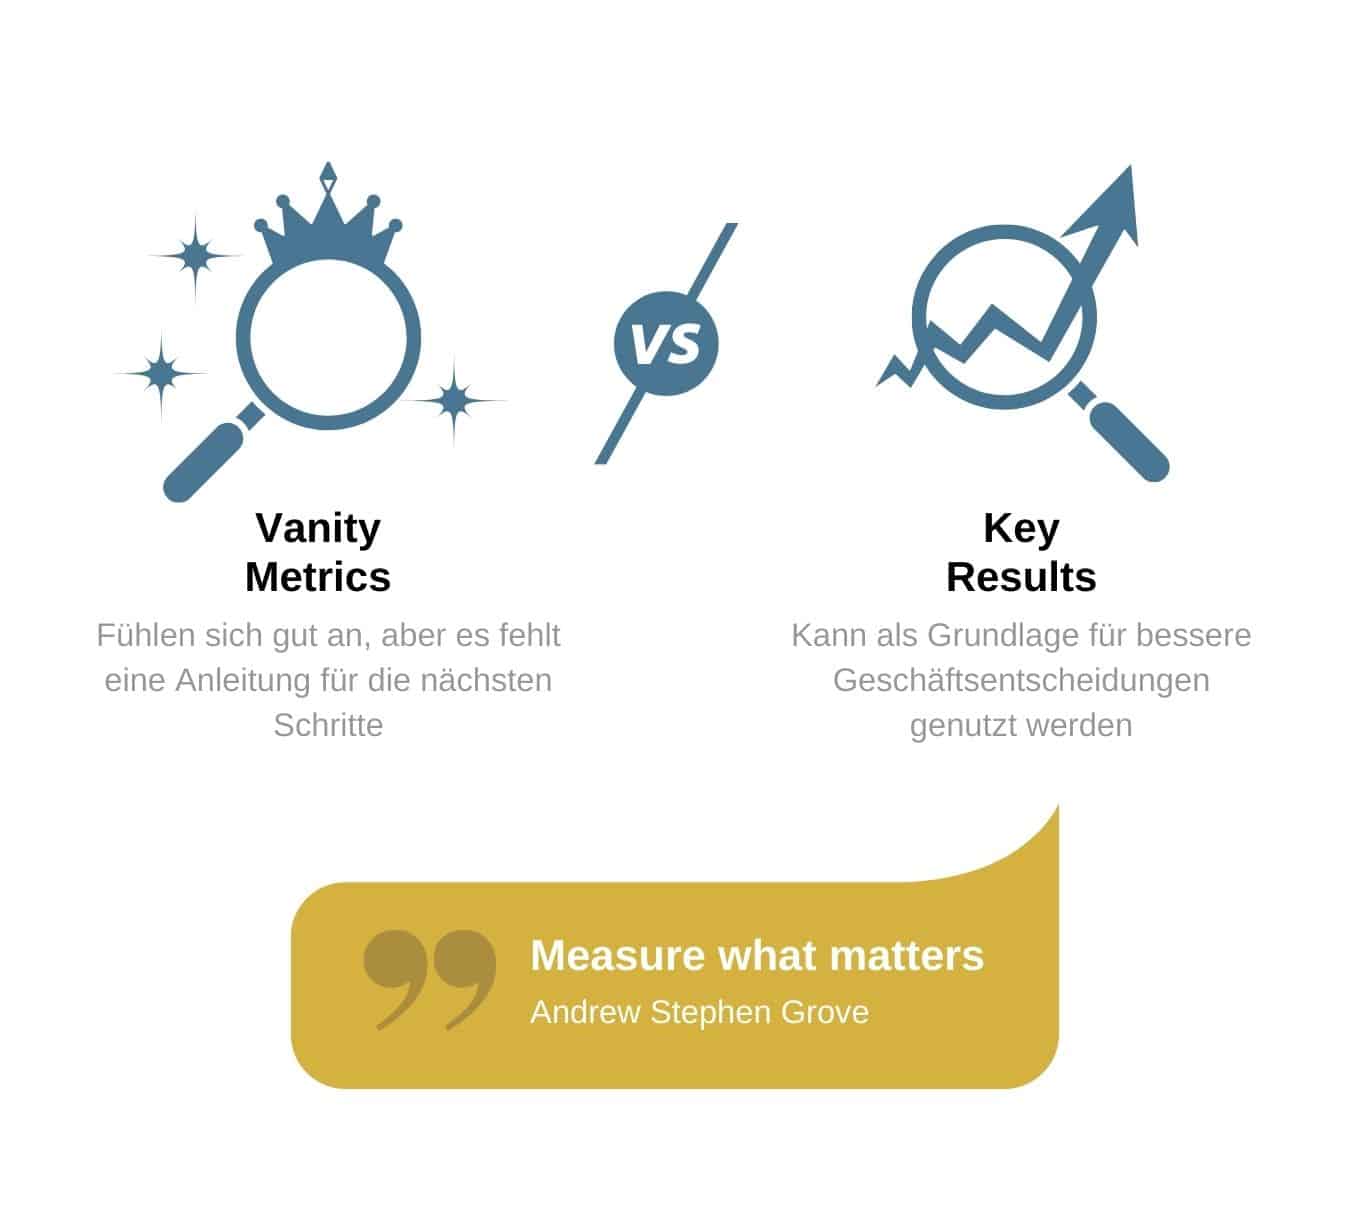
Simply following the vanity indicators gives them a false sense of achievement. Just because a company can create an upward and rightward curve does not mean that business is going well. Of course, companies can communicate vanity metrics externally, for example to the media, but only metrics that are truly meaningful for success should be used for key results. Vanity indicators are not completely useless, just don’t let them fool you.
There are a few ways to find really meaningful indicators in vanity metrics. For example, 30% of registered users are active once a month, 10% are active once a day and 10% of daily users correspond to the maximum number of simultaneous users.